Airplane Scatter as the Main Propagation Mode for VHF DX across the Alps - Analysis and Planning

(2025-08-16) PE1ITR

Introduction

Following my earlier analysis of tropospheric propagation hotspots over the Alps, this article focuses on airplane scatter as the main VHF propagation mode for portable DX operations in the Alpine region.

While tropo openings on 144 MHz can provide exceptional conditions, they are rare-occurring only a few days per year—and prove even less useful at 432 MHz due to higher coupling losses between inversion layers. In contrast, airplane scatter offers a more consistent opportunity for long-distance contacts, making it an attractive and predictable option for portable operations.

Air Traffic Patterns over the Alps

To evaluate the potential for airplane scatter, I analyzed ADS-B aircraft position data collected from the airscatter HAM radio network. The dataset covers three days - Friday, Saturday, and Sunday - which match the days I plan to operate portable.
Although there are small day-to-day variations, the main flight corridors across the Alps remain largely consistent. For this study, I focused on the afternoon period, which matches my planned operating times (13 - 19 UTC). The results provide a stable foundation for predicting scatter opportunities.

Figure 1


Airplane density heatmap of major flight corridors across the Alps on July 18, 2025. Only flights above 10 km altitude are shown. Each colored spot represents the number of aircraft passing through a 3 × 3 km cell; only cells with more than 5 positions are displayed.

Figure 2


Figures 2 & 3 show similar heatmaps for July 19 and July 20, confirming the overall corridor stability.

Figure 3


Target DX Locations, Optimizing Scatter Locations and Timing

To determine the best operating points, I took a statistical approach. The goal was to find sub-squares in the northern Alps where the scatter midpoint aligns with the main aircraft corridors.

First, I identified ten well-known Italian stations located in and around Milan, Parma, Modena, Bologna, Venice, and Trieste — mainly in grid squares JN34, JN44, JN45, JN54, and JN65. I have previously worked some of these stations from Luxembourg (JO30) via airplane scatter, mostly on 144 MHz and occasionally on 432 MHz, with contact distances up to 730 km. These proven paths served as targets for the analysis.

For each main square on the northern side of the Alps, I calculated which sub-square would see the greatest number of aircraft in a 10 x 40 km scatter midpoint area for all targets combined. Calculations were done for each hour between 13 UTC and 19 UTC. The top three sub-squares were ranked, and for each, the hour with the highest aircraft density was noted.

The program’s input consisted of: No check was made for on-site suitability (terrain, accessibility); that is a separate step in the planning.

Main Square Day of Week 1st, 2nd and 3rd best sub square
JO30 Friday JO30HA (163), JO30AB (157), JO30AC (154).
JN39 Friday JN39KM (200), JN39HP (192), JN39LN (190).
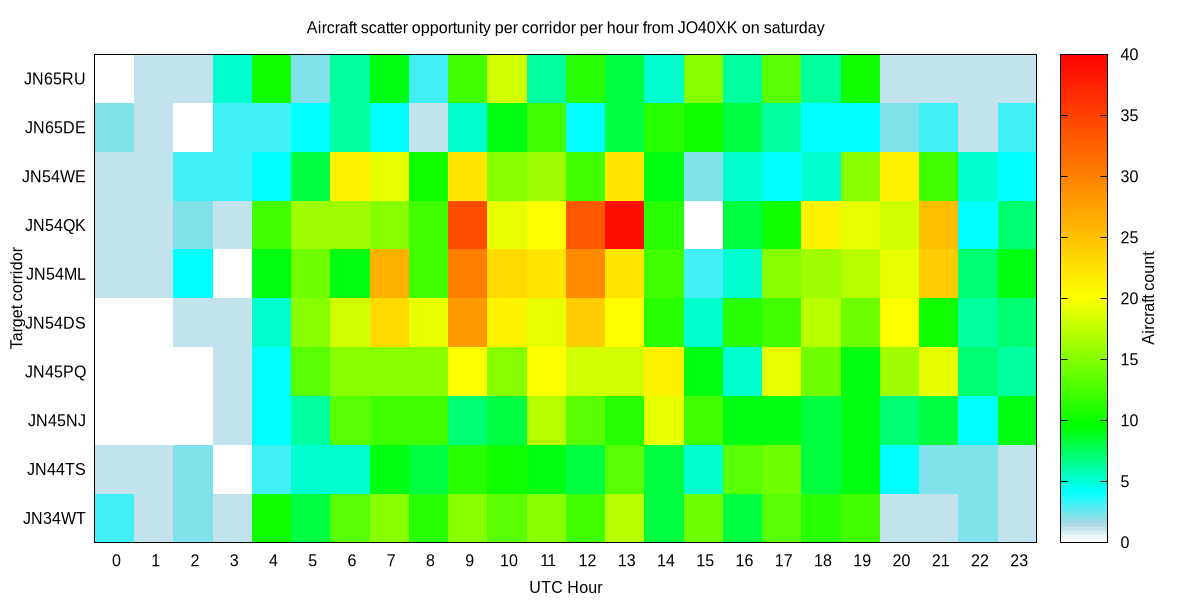
JO40 Saturday JO40XK (178), JO40XL (172), JO40XM (172).
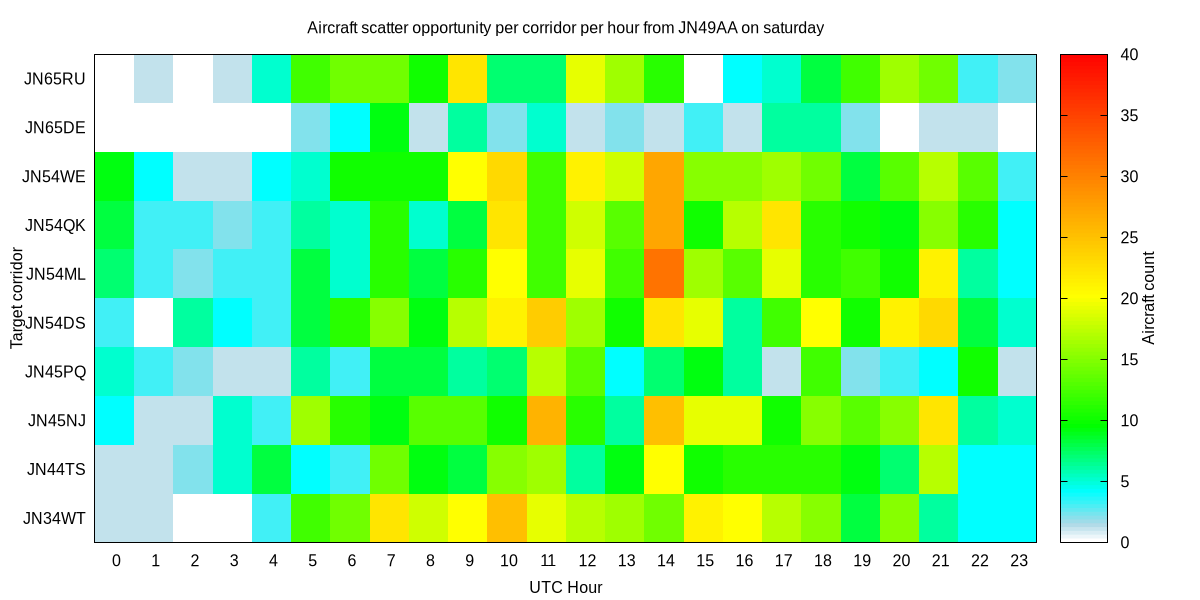
JN49 Saturday JN49AA (185), JN49BA (182), JN49CA (171).
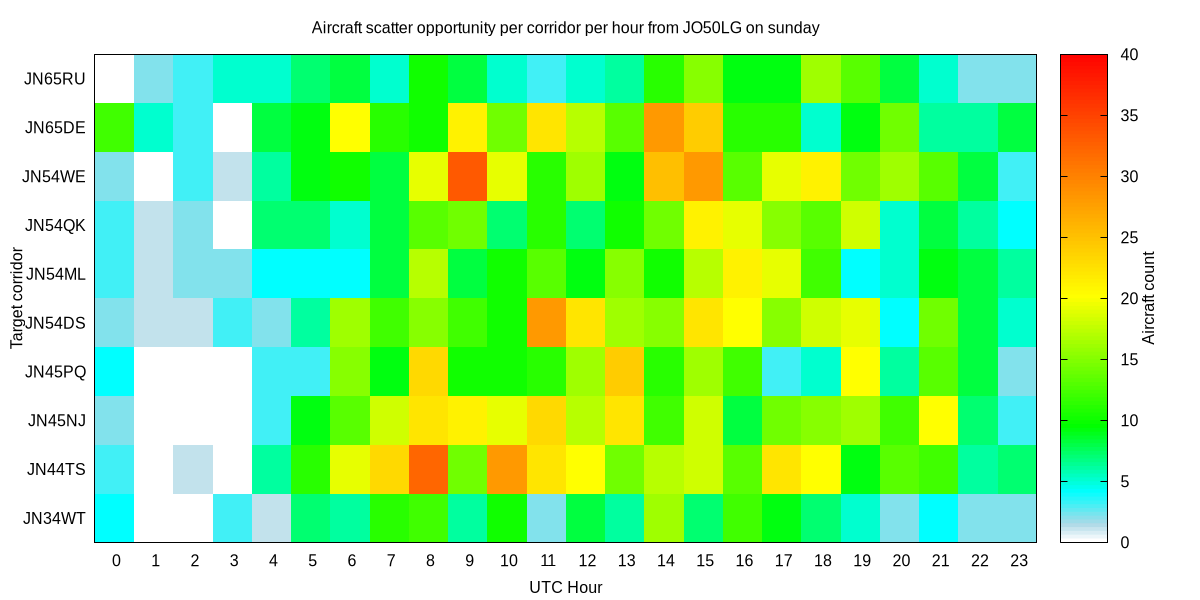
JO50 Sunday JO50LG (186), JO50LF (182), JO50LE (181).
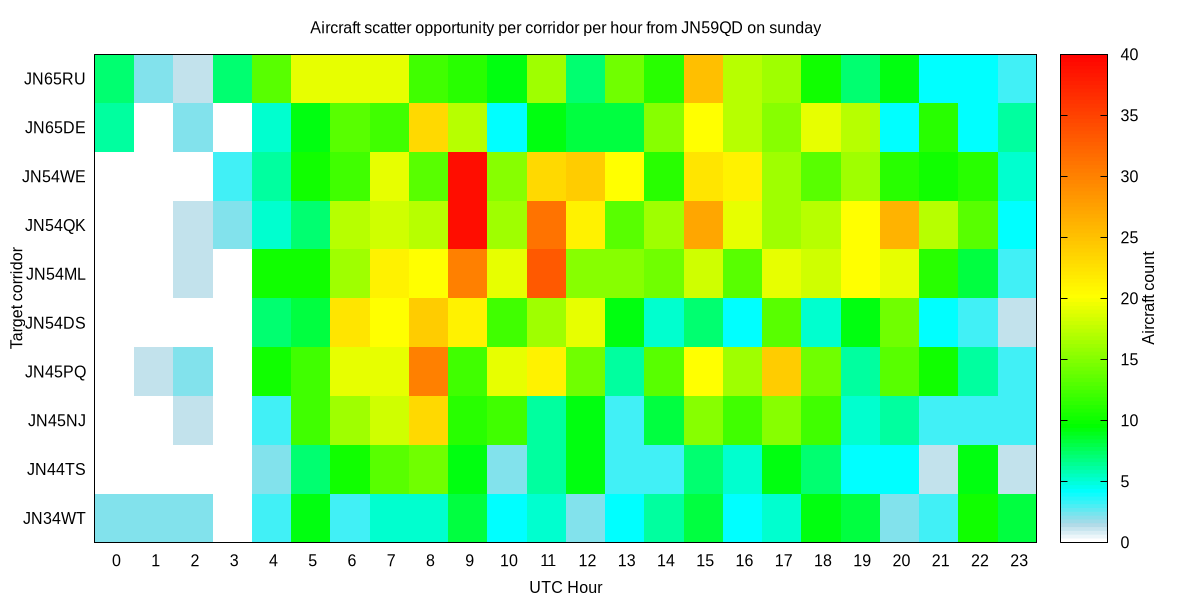
JN59 Sunday JN59QD (169), JN59QU (169), JN59IW (168).
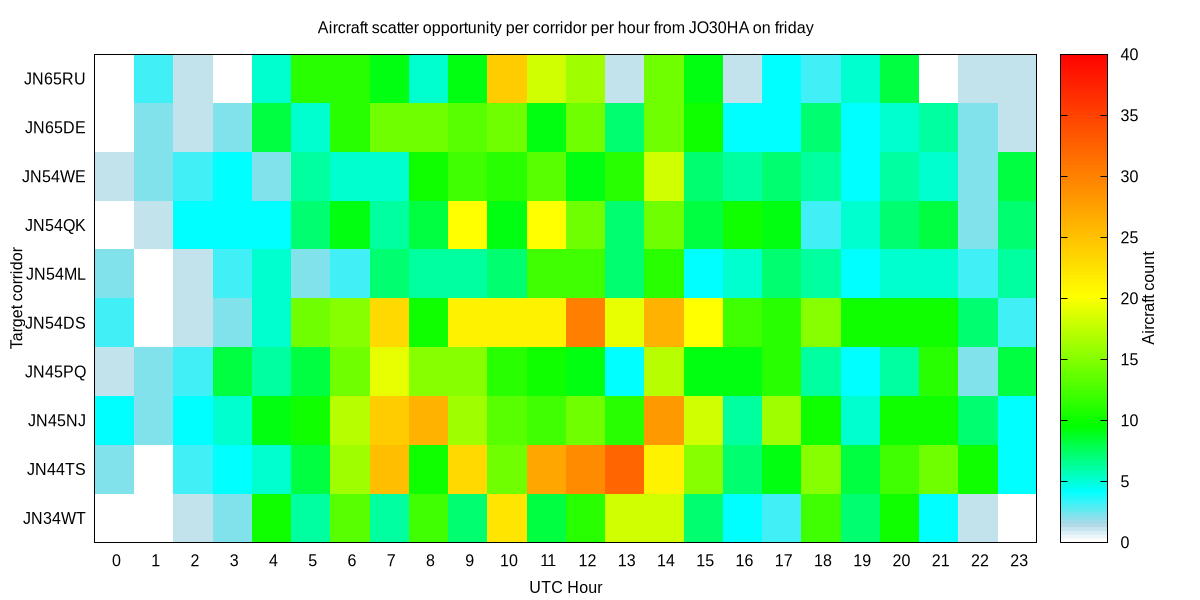
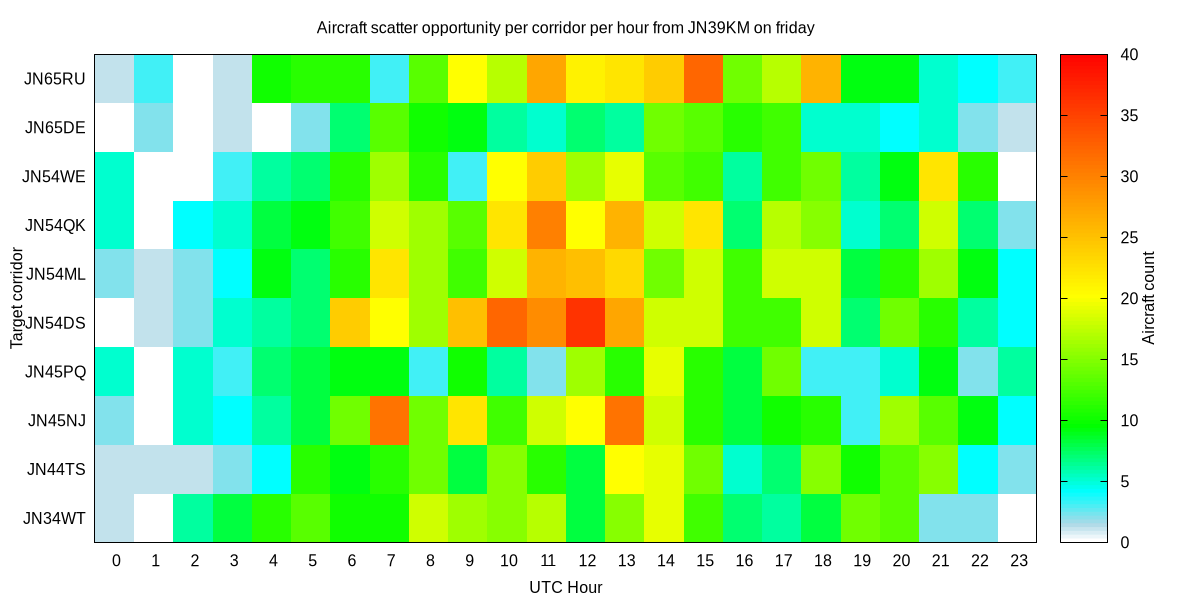


Practical Planning and Verification

For each best sub-square, I plotted the hourly distribution of aircraft for all ten Italian targets.
These plots - time (UTC) on the x-axis, aircraft count on the y-axis - confirm whether the predicted peak matches a realistic operating window. In practice, the theoretically best sub-square may be inaccessible or unsuitable for take-off, so I also consider nearby sub-squares.

Figure 4


Below is a table showing the hourly aircraft rate for each 1st best subsquare to the selected target locators. It is noticeable that for some locations the better times are before noon and for other locations a little later in the day.

1st best sub square Graph
JO30HA
JN39KM
JO40XK
JN49AA
JO50LG
JN59QD


Measurements

On August 13, 2025, I operated from JO30BA (Luxembourg) on 432 MHz, working several Italian stations and one Croatian station. I also deployed a 10-element Yagi for 1090 MHz ADS-B reception to record aircraft positions. The aim was to determine how far I could detect aircraft, and thus estimate the effective scatter range.

Even though JO30BA lies north of the ideal scatter line, the measured midpoints matched the known flight paths.

Figure 5


Just below the 432 MHz antenna is a 10 element 1090 MHz ADSB Yagi antenna vert.pol. to collect aircraft positions.

Figure 6


The map shows the positions of aircraft as I received them. An aircraft must be spotted at least twice at a given position for a position to be colored. The color scale indicates the number of positions during the session. It's clearly visible that the aircraft corridors are starting to emerge, as can be seen on the maps at the beginning of this web article.

Conclusion

This study shows that airplane scatter is the most reliable and predictable VHF propagation mode across the Alps. Compared to the rare tropo openings — especially at 432 MHz — scatter offers frequent opportunities and allows for precise operational planning.

By combining real-world air traffic data with scatter geometry, portable operators can:


HOME | Go Back