Tropospheric Radio Propagation Hotspots over the Alps
(2025-07-14) PE1ITR
Hotspot Areas
In preparation for a DX-pedition focusing on 144 and 432 MHz across the Alps, an analysis was conducted to identify favorable locations and conditions for tropospheric radio propagation. Heatmaps generated from FT8 DX-spots recorded on selected days clearly indicate that the region between Stuttgart, Munich, and Santis constitutes a prominent hotspot area. Additionally, the adjacent area around the Inntal valley consistently shows elevated levels of activity. Although airplane scatter is the most commonly encountered propagation mode in this region, this investigation specifically targets pure tropospheric conditions.
These hotspot areas typically emerge when atmospheric pressure on the southern side of the Alps exceeds that on the northern side, conditions frequently associated with fohn winds. The concentration of radio contacts aligns distinctly with recognizable geographical features such as valleys and mountain passes, acting as natural corridors for radio wave propagation. These insights highlight these particular regions as optimal for establishing reliable troposcatter contacts during a DX-pedition.
It is important to note that tropospheric path attenuation on 432 MHz can be significantly higher, typically 10 to 20 dB, compared to 144 MHz, due to differences in coupling between scatter areas and tropospheric duct layers.
The use of FT8 DX-spots as a data source provides a high density of observations, making it well suited for mapping propagation conditions statistically. However, it is important to note that the spatial and temporal distribution of these spots is also strongly influenced by operator activity on the band. Amateur activity levels depend not only on propagation conditions but also on personal schedules and operating habits, factors that are beyond the control of any propagation analysis.
Heatmap Generation Methodology
The hotspot areas depicted in the heatmaps were identified based on numerous intersecting propagation paths recorded within specific regions. DX-spots collected over a defined analysis period served as the primary data source.
To refine the clarity and accuracy of the maps, a filtering technique was applied to minimize the influence of airplane scatter. This involved selecting only contacts with significant directional variation in signal azimuth, effectively eliminating reflections from aircraft, which typically exhibit limited and consistent directional patterns.
Consequently, the resulting maps do not illustrate individual contact paths but instead highlight regions where substantial tropospheric propagation activity is concentrated, thus providing valuable insights for the planned DX-pedition.
Figure 1
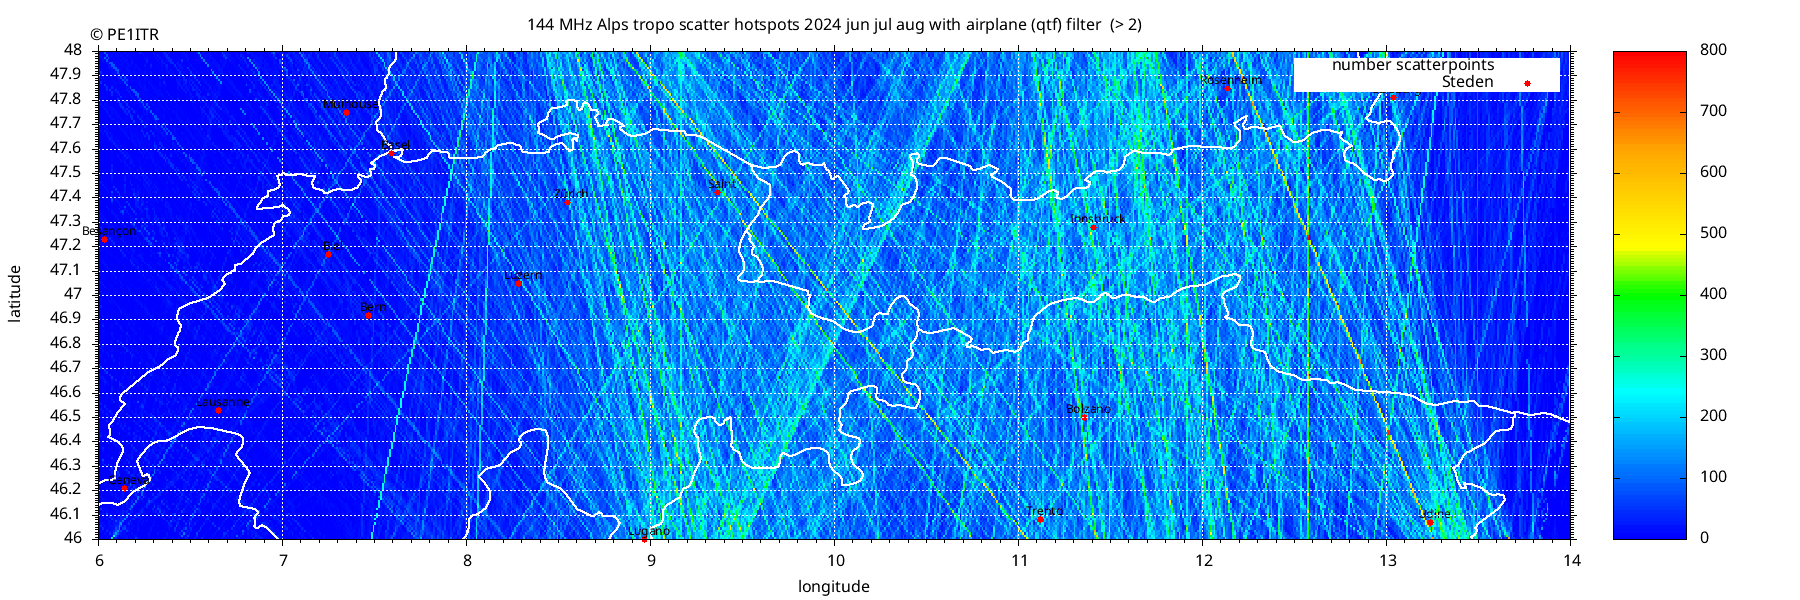
Aggregated heatmap showing 144 MHz tropospheric scatter hotspots over the Alpine region during June, July, and August 2024, also employing airplane scatter filtering (azimuthal variation threshold > 2 degrees). This longer-term analysis further emphasizes stable hotspot regions, reaffirming the significance of specific valleys and mountain corridors as favorable propagation pathways for reliable tropospheric communication.
Figure 2
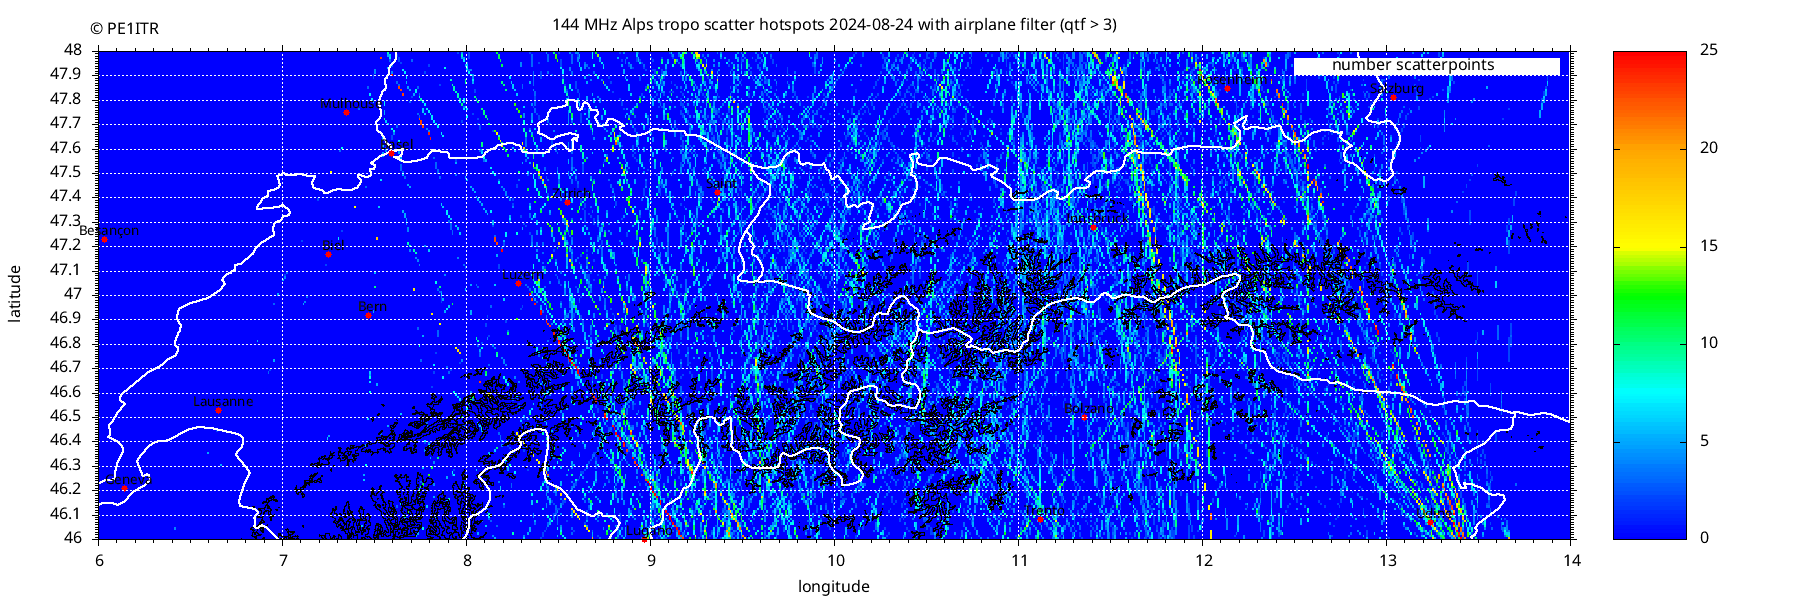
Heatmap of tropospheric scatter hotspots on 144 MHz over the Alpine region on August 24, 2024, with airplane scatter filtering applied (azimuthal variation threshold > 3 degrees). Clearly visible are concentrated hotspot regions, notably between Stuttgart, Munich, and Santis. And also the Inntal valley. The hotspots (yellow and red areas) represent high densities of intersecting radio propagation paths.
Refractivity Gradient and Inversion Layers
An additional layer of analysis involved calculating the vertical gradient of the modified refractivity index (dM/dh) using atmospheric data from the ERA5 dataset. The provided maps depict the refractivity gradient at specific altitudes 700 m and 1400 m above sea level at 18:00 UTC on August 24, 2024.
The refractivity gradient, derived from temperature, relative humidity, and atmospheric pressure data, serves as a key indicator for identifying atmospheric inversion layers. Pronounced inversions, visible as distinct areas of higher gradients (yellow to red), significantly enhance tropospheric propagation by trapping radio signals within atmospheric ducts. These inversion conditions correlate closely with the identified hotspot regions, further validating their suitability for reliable tropospheric communications during planned DX-peditions.
Figure 3
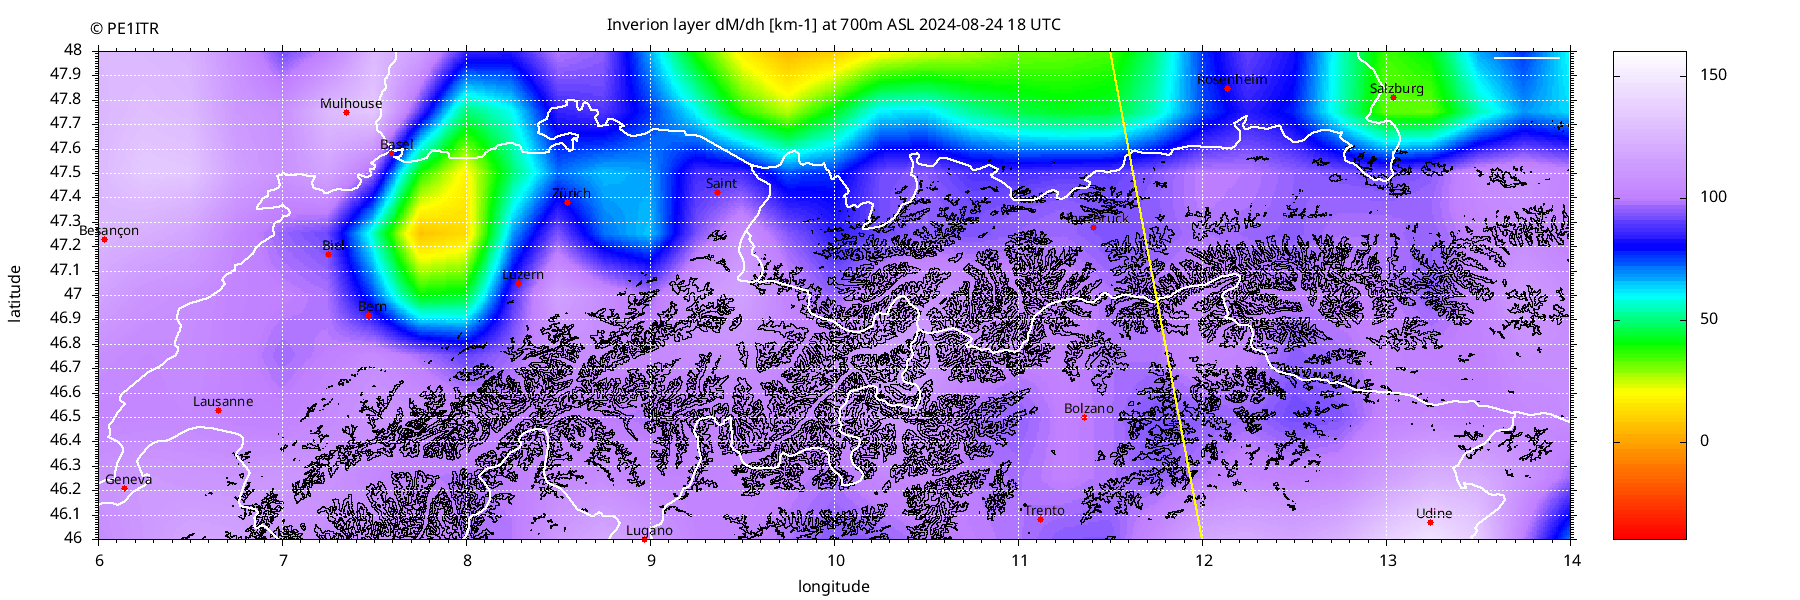
Figure 4
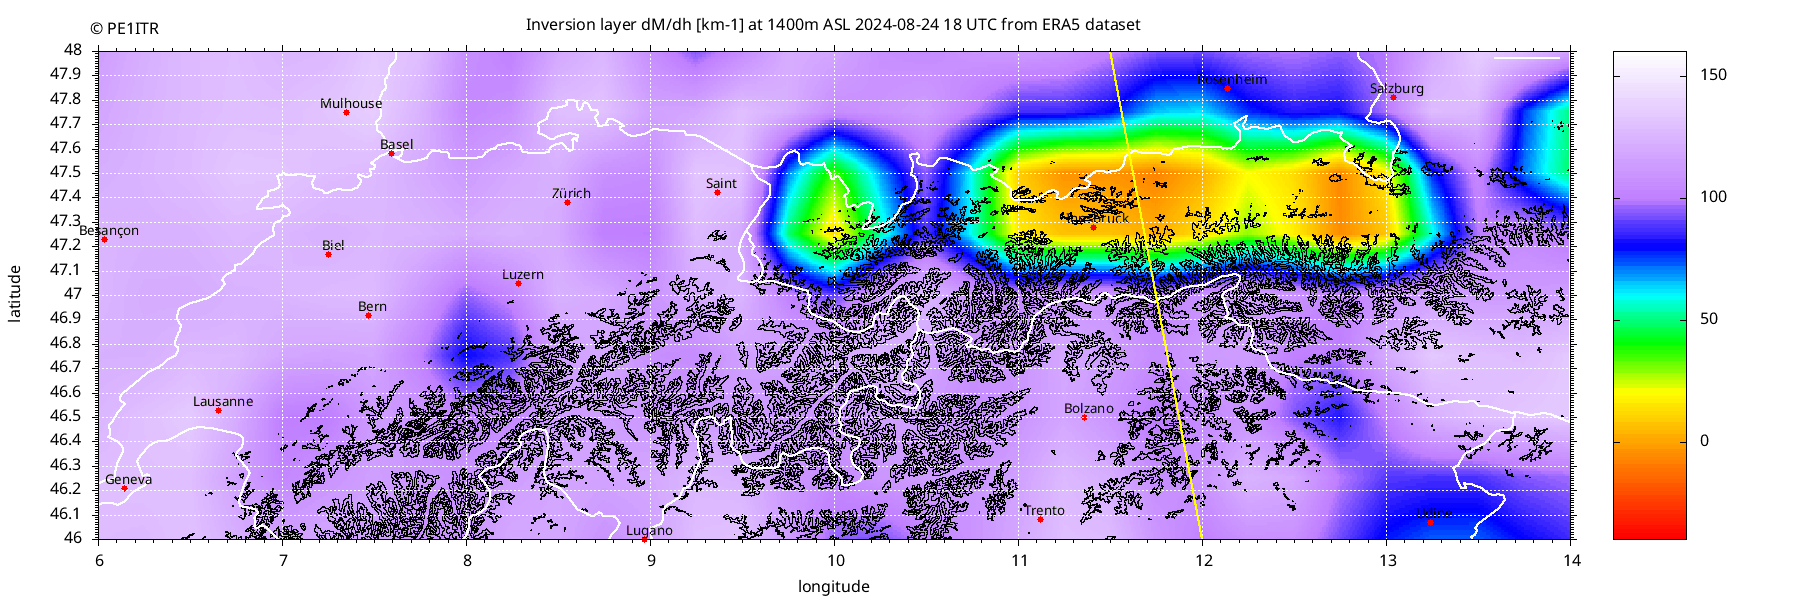
Inversion layer strength (vertical gradient of the modified ref In preparation for a DX-pedition focusing on 144 and 432 MHz across the Alps, an analysis was conducted to identify favorable locations and conditions for tropospheric radio propagation. Heatmaps generated from FT8 DX-spots recorded on selected days clearly indicate that the region between Stuttgart, Munich, and Santis constitutes a prominent hotspot area. Additionally, the adjacent area around the Inntal valley consistently shows elevated levels of activity. Although airplane scatter is the most commonly encountered propagation mode in this region, this investigation ractivity, dM/dh) at 700m (top) and 1400m (bottom) above sea level at 18:00 UTC on 24 August 2024, based on ERA5 atmospheric data. Regions of strong inversion (yellow to blue) align closely with the previously identified tropospheric scatter hotspot areas, indicating a direct correlation between enhanced inversion layers and the spatial concentration of VHF propagation paths over the northern Alps.
Vertical Cross-Sections along the Propagation Path
To further investigate the vertical structure of the tropospheric environment along potential DX paths, vertical cross-sections of the refractivity gradient (dM/dh) were constructed between locator squares JN57UX and JN66BB. The figures illustrate the distribution of dM/dh as a function of height and distance along the propagation path, superimposed on the terrain profile of the Alps. The calculation uses hourly ERA5 reanalysis data and interpolates key meteorological parameters (temperature, relative humidity, and pressure-derived geopotential height) onto a fine spatial grid along the direct path. For each point along the route, the modified refractivity M was computed at multiple altitudes, and the vertical gradient was derived numerically.
These cross-sectional plots highlight layers of enhanced refractivity gradient—particularly visible as colored bands (yellow to blue) close to the terrain or at specific altitudes. Such features indicate the presence of inversion layers or ducts that are capable of trapping or guiding VHF/UHF radio waves, thus supporting extended tropospheric propagation. The direct visualization of these layers, in conjunction with the terrain shadow, offers valuable insight for selecting optimal times and frequencies for establishing long-distance radio contacts over the Alpine region.
The prevailing theory is that radio scatter occurs primarily at the mountain ridge, followed by coupling into duct layers situated at 1400 m and, to a lesser extent, at 700 m altitude. The effectiveness of this coupling is governed by both the angle of incidence and the geometry of the refractive layer. Calculations reveal that the coupling efficiency is significantly higher for 144 MHz compared to 432 MHz, which is consistent with the observed differences in propagation range between these frequencies under similar ducting conditions.
Duct Coupling Efficiency and Frequency Dependence
To enable effective VHF ducting, radio signals must enter the duct layer at or below a critical angle, allowing propagation through refraction and trapping. The efficiency of this coupling strongly depends on frequency, duct thickness, and the angle of incidence. At 144 MHz (λ = 2.08 m), a typical duct thickness of 200 - 500 meters is sufficient to support guided propagation when the entry angle is below approximately 2 - 3°. At 432 MHz (λ = 0.69 m), the same duct becomes effectively too thick relative to the wavelength, leading to leakage or poor trapping. This results in an entry loss that is 10 - 20 dB higher compared to 144 MHz under identical conditions. This frequency-dependent behavior explains why scatter hotspots and duct-enhanced propagation are observed at 144 MHz but are absent at 432 MHz, despite similar atmospheric and terrain profiles. Coupling between multiple duct layers (e.g., a fohn-induced duct at 1400 m and a surface inversion around 700 m) requires favorable geometry, sufficient signal strength, and a refractive transition zone that supports tunneling or reflection—conditions rarely met, especially at higher frequencies.
Figure 5
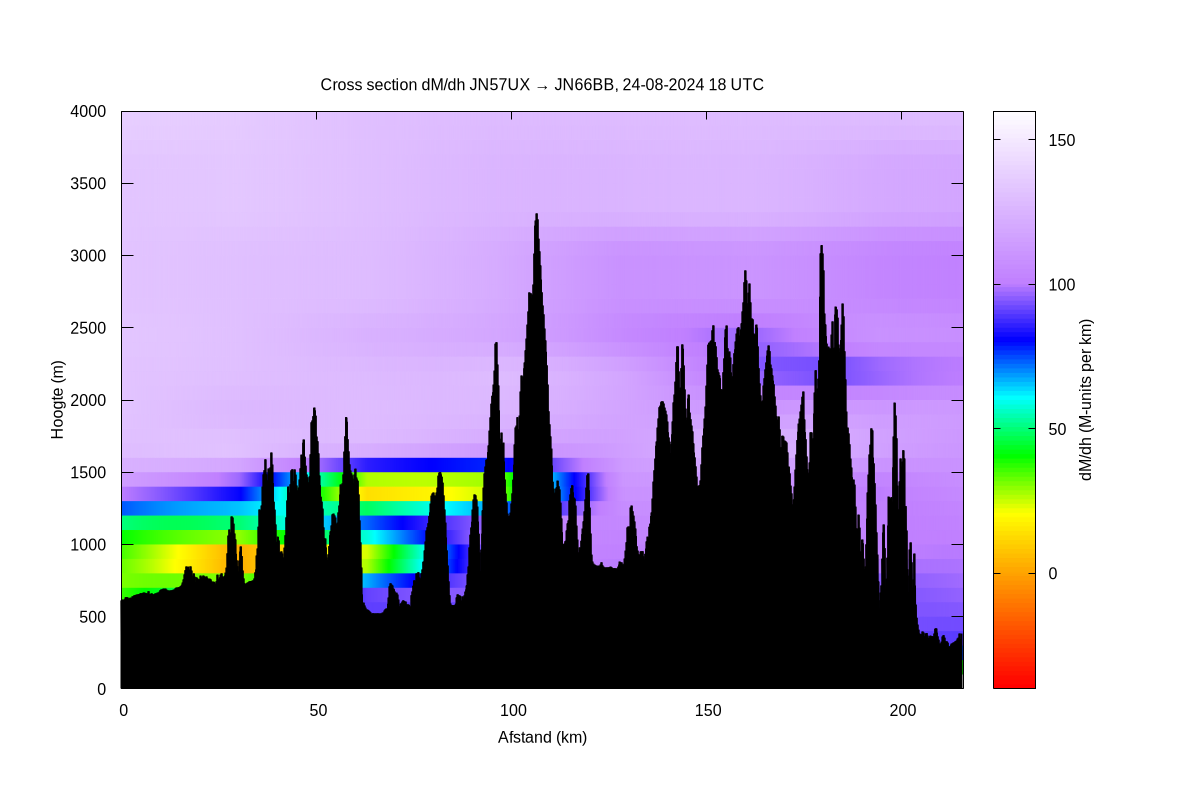
Vertical cross-section of the refractivity gradient (dM/dh) along the path from JN57UX to JN66BB at 18:00 UTC on 24 August 2024. Enhanced dM/dh layers (green to blue) are visible around 1000–1500 meters above sea level near the northern slopes, indicating the presence of strong inversion or ducting layers. The black profile represents the underlying Alpine terrain along the direct radio path.
Seasonal and Diurnal Patterns in Spot Activity
When evaluating spot data over the course of a year, it is evident that the months of June, July, August, and September are most favorable for this type of tropospheric propagation, as these months show the highest spot counts. Within the month of June, the distribution by hour reveals that the largest number of spots typically occurs between 16:00 and 17:00 UTC. Whether this is directly related to enhanced propagation or is influenced by operator activity—such as the timing of the activity contest remains unclear. Notably, the 16:00 - 17:00 UTC peak precedes the official start of the activity contest.
Focusing on 24 August as a case study, inversion layers begin to develop from 15:00 UTC onwards, becoming clearly visible around 16:00 UTC and reaching optimal conditions according to refractivity maps at 18:00 UTC. The hourly distribution of spot activity on that day peaked at approximately 15:30 UTC, with a gradual decline toward 20:00 UTC. This temporal pattern corresponds reasonably well with the development of inversion conditions, although on this specific day, the activity peak appears slightly earlier than might be expected from the inversion evolution alone.
In practice, the most effective propagation i.e., strong enough inversion at the right altitude and with optimal coupling to the terrain—may indeed occur slightly earlier than the theoretical maximum in the refractivity charts would suggest. In summary, the refractivity maps and cross-sections provide physical justification for enhanced propagation as early as 15 - 16 UTC, especially when considering the interplay of inversion layer strength, vertical position relative to terrain, and practical coupling conditions for VHF/UHF signals over the Alps.
Figure 6
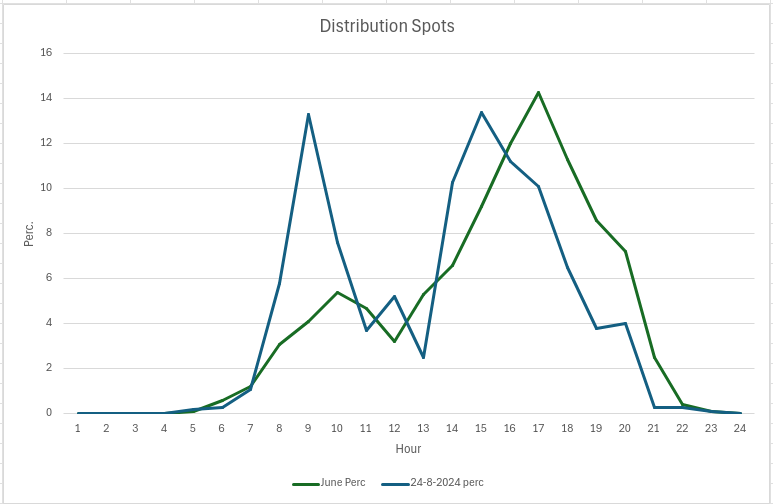
Hourly distribution of FT8 spots as a percentage of the daily total, comparing all days in June (green) with 24 August 2024 (blue). While both distributions show a peak in the late afternoon associated with favorable propagation conditions, the pronounced early morning peak on 24 August (a Saturday) is atypical and likely unrelated to tropospheric ducting, reflecting either alternative propagation mechanisms or increased weekend operator activity.
Conclusions and Key Findings for Alpine DXpeditions
This study provides several practical insights for VHF/UHF operators planning a DXpedition across the Alpine region, particularly in the JN39, JN49, and JN59 gridsquares:
- Hotspot Localization:
The main troposcatter hotspots are consistently found near the northern foothills of the Alps, especially in regions between Stuttgart, Munich, and Santis, as well as the Inntal corridor. These areas repeatedly demonstrate a higher density of long-distance contacts.
- Seasonal and Diurnal Timing:
The highest probability of tropospheric propagation occurs in the summer months (June to September). Within this period, late afternoon (15:00 - 18:00 UTC) typically offers the most favorable conditions, correlating well with the development of strong inversion layers.
- Propagation Mechanisms:
While airplane scatter remains the most frequent propagation mode, pure troposcatter-facilitated by atmospheric inversion and ducting-can be targeted by selecting days with a pronounced pressure difference across the Alps (e.g., fohn events) and strong refractivity gradients around 1000-1500 m altitude.
- Band Selection:
Propagation on 144 MHz is generally more robust under ducting conditions compared to 432 MHz, where increased path loss and less effective coupling to duct layers result in weaker and less frequent long-distance contacts.
- Operator Activity Caveat:
FT8 spot density is not only a function of propagation but is also influenced by operator activity patterns, which may lead to artificial peaks—especially during weekends or contests.
- Forecasting and Real-Time Monitoring:
Utilizing real-time weather data (pressure maps, temperature inversions, and humidity profiles) can further optimize the timing and location of operating efforts, increasing the chance of successful DX.
These findings should assist in planning station setup, choosing operating times, and selecting grid locations to maximize the chances of establishing long-distance VHF/UHF contacts during the expedition.
Due to the limited amount of spot data on 432 MHz, no reliable hotspot analysis could be made for this band… Further study with dedicated 432 MHz activity or beacon monitoring would be needed to produce meaningful hotspot maps for this band.
A follow-up article (Part 2) will focus on the analysis of optimal locations and timing for maximizing airplane scatter contacts across the Alps.
HOME | Go Back